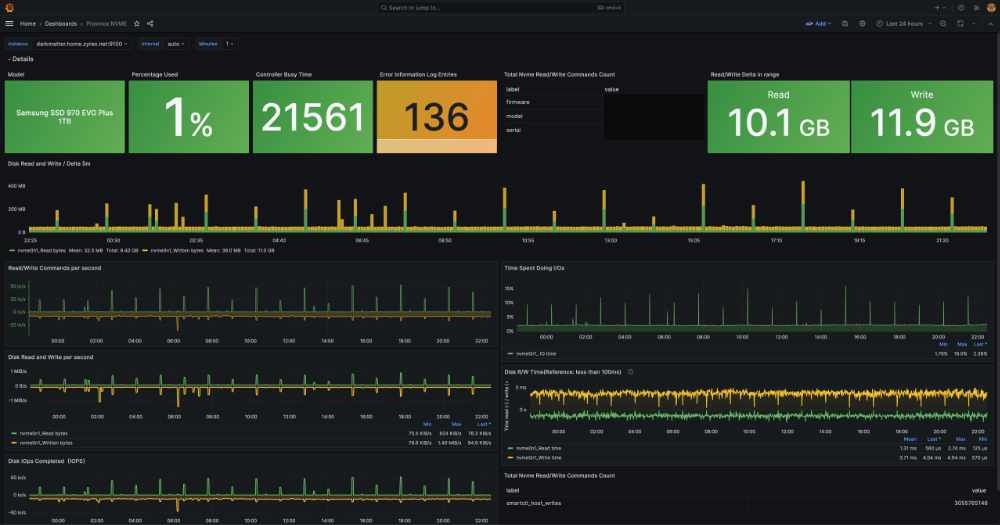
 Grafana dashboard showing smartctl data metrics
First we were blind,
but then we saw . . .
In a perfect world, we would always have access to the metrics and insights we need to make informed decisions. However, that’s not always the case. Sometimes, we stumble upon anomalies that existing tools can’t explain, and that’s when the magic of creating custom tools comes into play. So the other day I had a perplexing hard drive situation, and how I created a Python-based Prometheus exporter to unravel the mystery.
One day, I noticed something peculiar about one of my SSDs, /dev/nvme0n1. For a drive barely six months old running a proxmox host, the SMART data revealed it had read over 400TB and written around 40TB. Given the drive’s age and usage, these numbers seemed quite excessive, as I had not utilised the vms on the host almost at all.
SMART overall-health self-assessment test result: PASSED

SMART/Health Information (NVMe Log 0x02)
Critical Warning:                   0x00
Temperature:                        44 Celsius
Available Spare:                    100%
Available Spare Threshold:          10%
Percentage Used:                    1%
Data Units Read:                    782,198,938 [400 TB]
Data Units Written:                 79,308,191 [40.6 TB]
Host Read Commands:                 21,321,323,158
Host Write Commands:                3,055,772,687
Controller Busy Time:               21,561
Power Cycles:                       268
Power On Hours:                     15,138
Unsafe Shutdowns:                   184
Media and Data Integrity Errors:    0
Error Information Log Entries:      136
Warning  Comp. Temperature Time:    0
Critical Comp. Temperature Time:    0
Temperature Sensor 1:               44 Celsius
Temperature Sensor 2:               46 Celsius
Moreover, I noticed Percentage Used: 1%. For NVMe this is a vendor estimate of life consumed, where 100 means the estimated endurance has been used; it is not a direct “99% health” measurement and may exceed 100. The 400 TB read and 40.6 TB written figures remain observations from this specific drive and workload, not expected values for every SSD. NVM Express Base Specification
I decided to create a prometheus exporter in python as its installed by default in proxmox and it would not need any external dependencies, I also read up and there was a smartctl_exporter already written in go for the task but since i was only interested in very specific metrics, I decided to write my own.
I wrote a Python script that uses the smartctl command to collect SMART data from the drive, processes it into JSON format, extracts the metrics im interested in, and exports them into a Prometheus-friendly format.
Then created a Grafana dashboard to check out the drive smart data.
In the realm of ones and zeros,
Where data flows and metrics grow,
Smart drives whisper their tales,
Of reads and writes, of fails and ails.
Prometheus watches with keen eyes,
As bytes dance and metrics rise,
A symphony of digital might,
In the endless monitoring night.
In the realm of ones and zeros, Where data flows and metrics grow, Smart drives whisper their tales, Of reads and writes, of fails and ails.
Prometheus watches with keen eyes, As bytes dance and metrics rise, A symphony of digital might, In the endless monitoring night.
To make the deployment process seamless, I used Ansible.
In this scenario, Ansible placed the script, set permissions, and created the cron job. Node Exporter’s textfile collector reads .prom files on each scrape, so it does not need a restart for every update. The writer should create its temporary file in the collector directory and atomically rename it into place so Prometheus never reads a partial file. Node Exporter textfile collector
A maintained general alternative is smartctl_exporter. I keep my small script because it records exactly the mystery I was investigating; I would use the exporter when I need broad device coverage and maintained SMART mappings.
Creating custom tools when the need arises is an essential part of any DevOps or sysadmin toolkit. It’s not just about getting the job done but understanding what’s happening under the hood. This approach has made it possible to drill down on the peculiar behavior.
Python Script: smartctl_nvme_metrics.py
Ansible Playbook: ansible playbook
Buy Me a Coffee