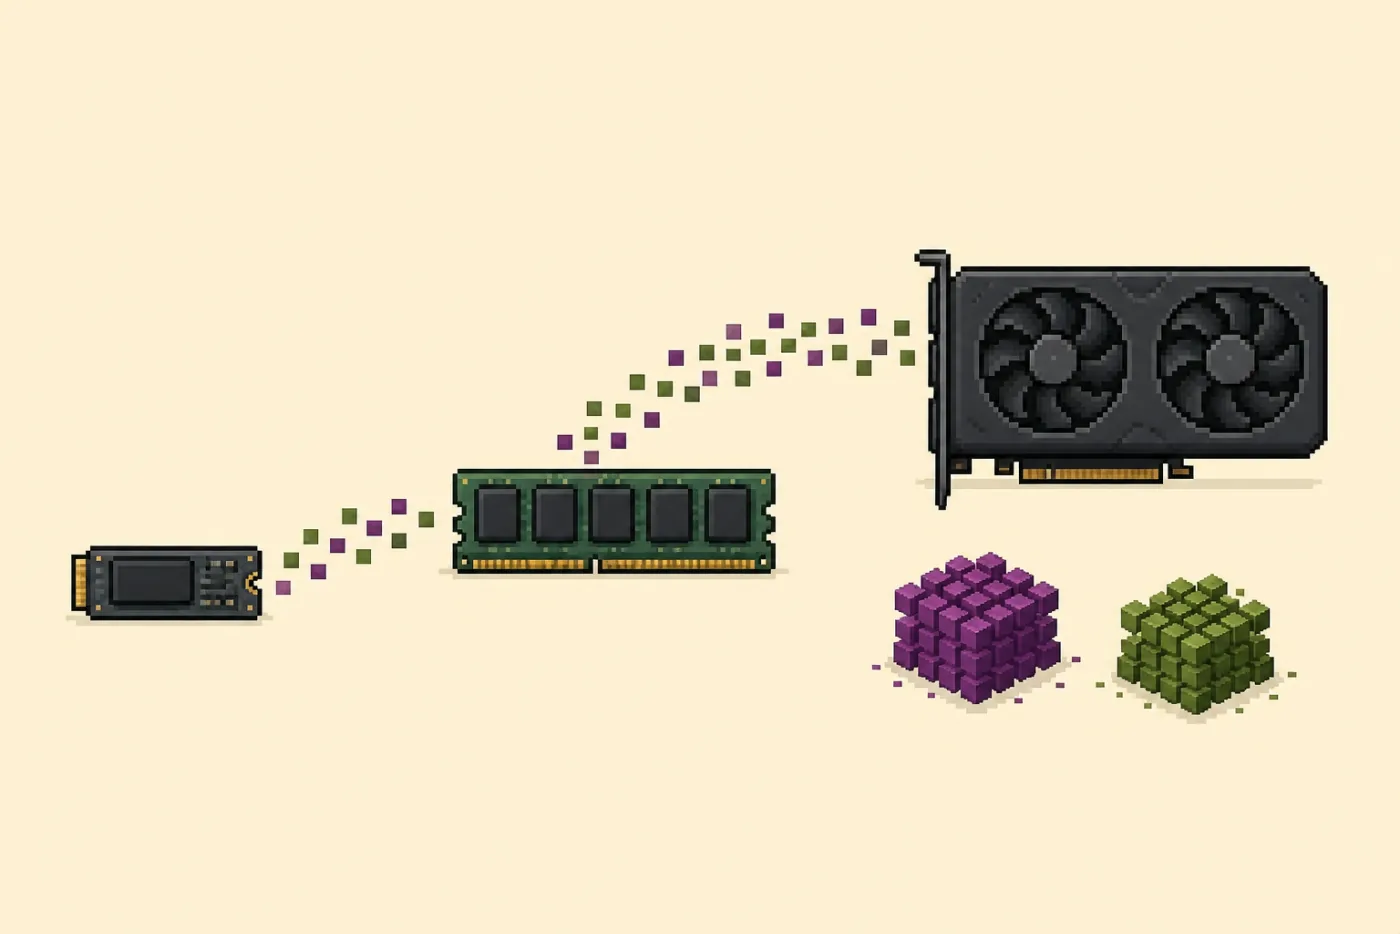
I had only meant to change a few Ollama settings. Each time I adjusted the context size or batch settings for an 8B model, I watched VRAM in btop fall towards 1 GB. When the next request arrived, it climbed back towards 8 GB.
The rise and fall made sense. Ollama was unloading and loading data as the workload changed. Still, it was hard to watch several gigabytes move without wondering what that movement was costing.
I wanted to use different local models in more n8n workflows, but every swap began to feel like a small act of damage. The GPU did not worry me much. The SSD did. If Ollama was reading the model weights again and again, was I shortening the drive’s life simply by experimenting?
The answer was reassuring, but understanding why meant following the data beyond the most visible graph on my screen.
btop could show me that GPU memory allocations had changed. It could not show me where the model data came from when VRAM filled again.
That data can take several paths:
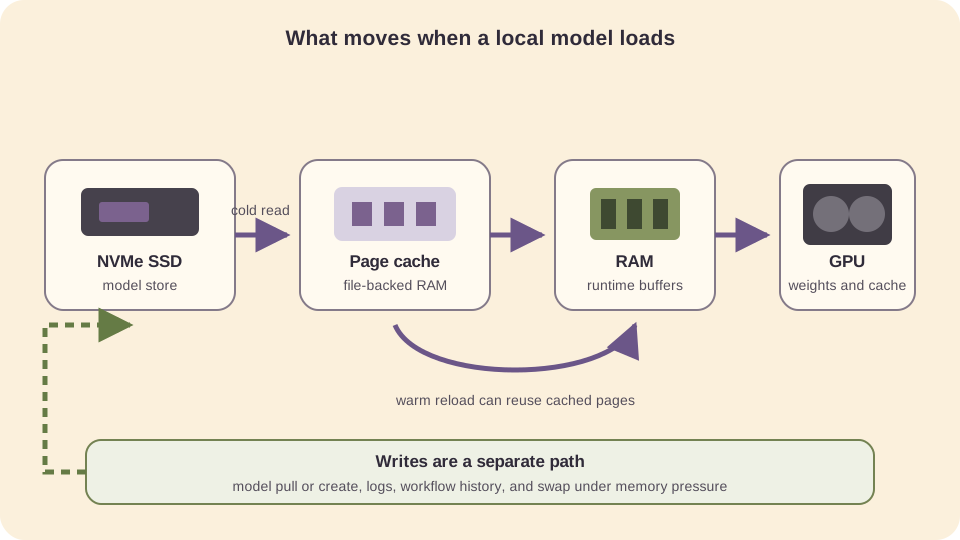
- A cold model load reads weight data from the model store into system memory and then places all or part of it in GPU memory.
- A later load may be satisfied partly or wholly from the operating system’s page cache.
- If the model is still resident, a request can reuse it and allocate only the context and compute buffers it needs.
- Under memory pressure, cached pages can be evicted and a later load must return to storage.
Linux keeps file-backed pages in its page cache so it does not have to return to the disk for every repeated read. The kernel behavior is described in Understanding the Linux Virtual Memory Manager. Whether a particular reload is warm or cold depends on the model size, the available RAM and what else the machine has done since the last request.
Changing the context length certainly changes memory demand. Ollama’s current documentation says that a larger context requires more memory, and ollama ps shows how a model is split between CPU and GPU. Neither tells me that every context change forces a complete SSD read. See Ollama’s context-length documentation and Ollama’s FAQ.
What I was really concerned about was how SSDs actually count reads and writes, and how only one of these affects drive wear. On an NVMe SSD, the SMART health log reports Data Units Read and Data Units Written separately, along with host read and host write commands. However, there’s no wear metric for terabytes read (TBR), because SSD endurance is measured in only writes.
A model load that really does reach the disk therefore increases host-read traffic, not the host-written total used for TBW. That was the point at which my worry began to ease. A cold reload can still have costs:
- extra latency before the first token;
- SSD controller activity and heat;
- PCIe and memory-bandwidth use;
- competition with other storage work.
Those costs can make a machine slower or hotter. They are worth watching, but they are not the same as consuming NAND program and erase cycles through writes.
Where writes can still come from
The relief came with an important qualification. Normal inference is mostly weight reads plus work in RAM and VRAM, but it would be misleading to say that the machine performs no writes. They can still come from several places:
ollama pulldownloads or updates model blobs;ollama createwrites a derived model;- the service manager and other applications write logs;
- workflow tools may persist prompts, results and execution history;
- the operating system may write to swap under memory pressure;
- databases, browser caches and monitoring tools keep doing their own work.
Ollama documents the standard Linux model directory as /usr/share/ollama/.ollama/models for its normal installer, while macOS and some user-run Linux setups use a home-directory store. OLLAMA_MODELS can move it elsewhere. The current locations and permissions are listed in the Ollama FAQ.
On my Linux machine, I check the service’s configured store and the space it uses rather than assuming a path:
systemctl show ollama --property=Environment
sudo du -sh /usr/share/ollama/.ollama/models
ollama list
But where do the reads come from?
Documentation explained the distinction that the reads are not that harmful, but it could not tell me whether a particular reload of a model came from RAM or the SSD. For that, I needed to watch block I/O while reproducing one model swap:
ollama ps
iostat -dx 1
In another terminal:
sudo iotop -oPa
ollama ps shows which models are resident and whether they are in CPU or GPU memory. iostat shows device reads and writes. iotop attributes active I/O to processes when the kernel and permissions allow it. Together, they show more of the journey than the VRAM graph alone.
For an NVMe drive, the controller’s cumulative counters provide the long view:
sudo nvme smart-log /dev/nvme0
The exact device might be /dev/nvme1 or another controller. Find it with lsblk rather than copying the example. Record data_units_read, data_units_written, host_read_commands and host_write_commands, run a controlled set of swaps, then record them again. The official NVMe command-line utility exposes the health data defined by the standard.
Making model swaps less disruptive
Once one understands what counts towards wear, model swapping becomes an ordinary performance problem. The remaining annoyance was the wait for the first token.
Ollama keeps a model in memory for a period after a request. The API’s keep_alive field can extend that period, set it indefinitely with a negative value, or unload immediately with 0. The server-wide equivalent is OLLAMA_KEEP_ALIVE. These controls are documented in Ollama’s model keep-alive FAQ.
For an n8n HTTP Request node, a request can include:
{
  "model": "qwen3:8b",
  "prompt": "Summarize this incident report",
  "keep_alive": "30m"
}
Buy Me a Coffee