The first sign was not an error on the Proxmox console. It was a switch notification saying that the host had disconnected after 20 days and 22 hours online.
The machine had not frozen. Its guests, bridges, and VLANs had simply vanished from the network together. Walking over and unplugging the Ethernet cable, then plugging it back in, brought everything back.
That ritual worked, which made it dangerous. A fix that always involves a walk to the rack can survive for months without ever explaining the fault.
The host used a single Intel ethernet port as the physical trunk beneath several VLAN interfaces and Linux bridges. When that one link stopped transmitting, management and every tagged network disappeared at once.
So at that point the job was not to debug each VLAN. It was to prove whether the failure lived below them.
# A useful horde of commands to understand what is happening with a ethernet port
lspci -nnk | grep -A3 -i ethernet
ethtool -i eno1
ethtool eno1
ip -br link show eno1
journalctl -k --since "today" | grep -Ei 'e1000e|hardware unit hang|link is (down|up)'
The adapter identified as an Intel I219-V using the in-kernel e1000e driver. The live link report looked healthy at the moment I checked it: 1000 Mb/s, full duplex, auto-negotiation on, and carrier detected.
The old kernel log was less polite:
e1000e ... eno1: Detected Hardware Unit Hang
e1000e ... eno1: Detected Hardware Unit Hang
...
e1000e ... eno1: NIC Link is Down
e1000e ... eno1: NIC Link is Up 1000 Mbps Full Duplex
The hardware-unit-hang message repeated every two seconds for several minutes before the link finally cycled. A cable replug forced a similar physical renegotiation, which explained why it recovered the machine without rebooting it.
The Linux kernel’s e1000e documentation covers the driver and its tunable parameters, while upstream ethtool is the standard tool for querying driver, link, EEE, offload, and statistics state. Neither source says that every Hardware Unit Hang on an I219-V has one universal cause. That became an important correction to my first theory.
EEE and ASPM were suspects, not a verdict
Energy Efficient Ethernet and PCIe Active State Power Management were obvious things to inspect because both can move hardware through lower-power states. They were initially tempting as the explanation.
Then ethtool reported this:
EEE settings for eno1:
disabled
Supported EEE link modes:  100baseT/Full
                           1000baseT/Full
Advertised EEE link modes: 100baseT/Full
                           1000baseT/Full
Link partner advertised EEE link modes: Not reported
That output does not prove EEE caused the failure. In fact, it says EEE was disabled when inspected. Supported and advertised capabilities are not the same thing as EEE being active.
The current state can be queried and, when the driver supports it, changed with:
ethtool --show-eee eno1
ethtool --set-eee eno1 eee off
The kernel ethtool interface reports separate enabled, active, advertised-mode, and peer-mode fields. That is why I now record the output before changing anything. If EEE is already disabled, repeatedly disabling it is not a diagnosis.
ASPM deserves the same restraint. The kernel parameter pcie_aspm=off really does disable PCIe Active State Power Management, as documented in the kernel command-line reference, but that does not prove ASPM caused a particular link hang. It also changes power management for the whole PCIe tree, not just one network adapter.
I kept both as controlled tests
- Save the current
ethtool, kernel, firmware, and BIOS state. - Replace the cable and move the switch port first.
- Check switch logs, port errors, negotiation, PoE state, and VLAN profile.
- Test one host-side change at a time.
- Wait long enough to cover the failure interval before claiming success.
The original failure appeared only after weeks at random so a clean afternoon proves very little.
A guardrail for the next silent outage
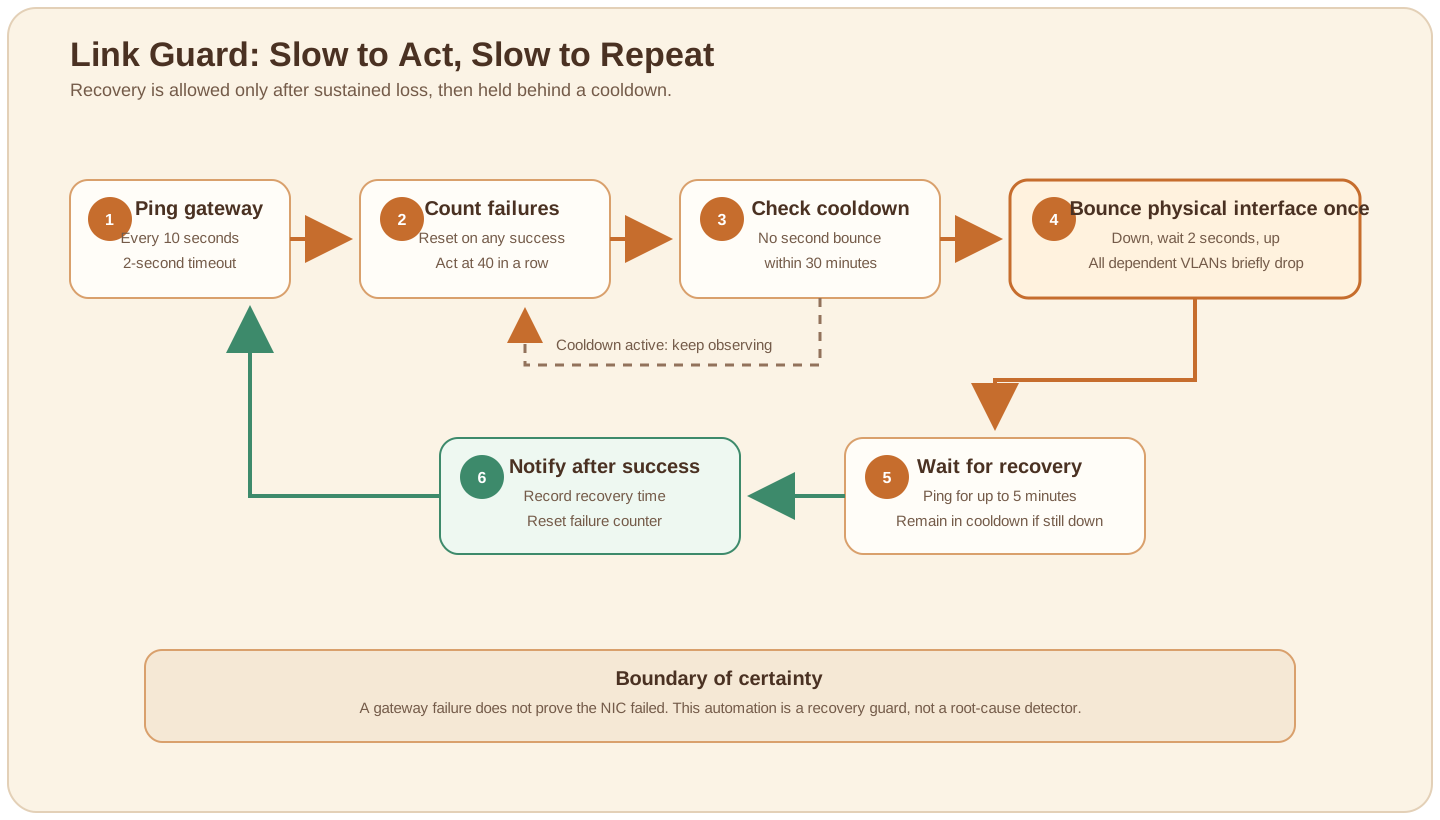
While the root cause remained under observation, I wanted the host to recover without requiring my hand on the cable. The recovery rule was deliberately slow:
- ping the local gateway every 10 seconds;
- require 40 consecutive failures;
- bounce only the physical interface;
- allow at most one bounce in 30 minutes;
- notify me only after a successful recovery ping.
At the configured interval, the threshold takes at least 6 minutes and 40 seconds, plus ping timeouts. This is not high availability. It is a last-resort response to a host that would otherwise remain unreachable indefinitely.
I installed the script as /root/link-guard.sh:
#!/usr/bin/env bash
set -u

IFACE="${IFACE:-eno1}"
GATEWAY="${GATEWAY:-}"
INTERVAL="${INTERVAL:-10}"
FAIL_THRESHOLD="${FAIL_THRESHOLD:-40}"
COOLDOWN="${COOLDOWN:-1800}"
PING_TIMEOUT="${PING_TIMEOUT:-2}"
STATE_FILE="${STATE_FILE:-/run/link-guard.state}"
LOCK_FILE="${LOCK_FILE:-/run/link-guard.lock}"
PUSHOVER_SCRIPT="${PUSHOVER_SCRIPT:-/root/pushover.sh}"
HOSTNAME_SHORT="$(hostname -s 2>/dev/null || hostname)"

if [[ -z "$GATEWAY" ]]; then
  echo "GATEWAY must be set in /etc/default/link-guard" >&2
  exit 2
fi

log() {
  printf '%s link-guard[%s]: %s\n' "$(date -Is)" "$$" "$*"
}

exec 9>"$LOCK_FILE" || exit 1
if ! flock -n 9; then
  log "another instance is running; exiting"
  exit 0
fi

FAILURES=0
LAST_RESTART=0
if [[ -f "$STATE_FILE" ]]; then
  # The file is created mode 0600 in /run and contains only these two integers.
  # shellcheck disable=SC1090
  source "$STATE_FILE" || true
fi

save_state() {
  umask 0077
  printf 'FAILURES=%q\nLAST_RESTART=%q\n' \
    "$FAILURES" "$LAST_RESTART" >"$STATE_FILE"
}

bounce_iface() {
  log "bouncing $IFACE"
  ip link set dev "$IFACE" down
  sleep 2
  ip link set dev "$IFACE" up
}

wait_for_recovery() {
  local start_ts tries=0
  start_ts="$(date +%s)"
  while (( tries < 60 )); do
    if ping -nq -c 1 -W "$PING_TIMEOUT" "$GATEWAY" >/dev/null 2>&1; then
      echo "$(($(date +%s) - start_ts))"
      return 0
    fi
    sleep 5
    ((tries++))
  done
  return 1
}

notify_recovered() {
  local elapsed="$1"
  if [[ -x "$PUSHOVER_SCRIPT" ]]; then
    "$PUSHOVER_SCRIPT" "LinkGuard ($HOSTNAME_SHORT)" \
      "Recovered after restarting $IFACE. Time to recovery=${elapsed}s"
  else
    log "notification script unavailable; skipping notification"
  fi
}

log "starting: IFACE=$IFACE INTERVAL=${INTERVAL}s THRESH=$FAIL_THRESHOLD COOLDOWN=${COOLDOWN}s"
save_state

while true; do
  if ping -nq -c 1 -W "$PING_TIMEOUT" "$GATEWAY" >/dev/null 2>&1; then
    if (( FAILURES > 0 )); then
      log "ping recovered after $FAILURES failures"
    fi
    FAILURES=0
    save_state
  else
    ((FAILURES++))
    log "ping failed ($FAILURES/$FAIL_THRESHOLD)"
    save_state

    if (( FAILURES >= FAIL_THRESHOLD )); then
      now="$(date +%s)"
      since=$((now - LAST_RESTART))

      if (( LAST_RESTART > 0 && since < COOLDOWN )); then
        log "threshold reached; cooldown has $((COOLDOWN - since))s left"
      else
        log "threshold reached; restarting $IFACE"
        bounce_iface
        LAST_RESTART="$(date +%s)"
        save_state

        if elapsed="$(wait_for_recovery)"; then
          log "link recovered after ${elapsed}s"
          notify_recovered "$elapsed"
          FAILURES=0
          save_state
        else
          log "restart attempted; gateway still unreachable"
        fi
      fi
    fi
  fi

  sleep "$INTERVAL"
done
I kept the site-specific values in /etc/default/link-guard:
IFACE=eno1
GATEWAY=<gateway-ip>
INTERVAL=10
FAIL_THRESHOLD=40
COOLDOWN=1800
PING_TIMEOUT=2
PUSHOVER_SCRIPT=/root/pushover.sh
STATE_FILE=/run/link-guard.state
The service starts after the network is considered online. Systemd documents network-online.target as a startup synchronization point whose exact meaning depends on the network manager, not as a permanent connectivity monitor. That is why the script still performs its own checks. See the systemd network-target explanation.
[Unit]
Description=Link Guard - bounce NIC on sustained gateway loss
After=network-online.target
Wants=network-online.target

[Service]
Type=simple
EnvironmentFile=-/etc/default/link-guard
ExecStart=/root/link-guard.sh
Restart=always
RestartSec=5s
CapabilityBoundingSet=CAP_NET_ADMIN CAP_NET_RAW
AmbientCapabilities=CAP_NET_ADMIN CAP_NET_RAW
NoNewPrivileges=true

[Install]
WantedBy=multi-user.target
I installed it with restrictive permissions and checked the unit:
chmod 700 /root/link-guard.sh
chown root:root /root/link-guard.sh
chmod 600 /etc/default/link-guard

systemctl daemon-reload
systemctl enable --now link-guard.service
systemctl status link-guard.service
journalctl -u link-guard.service -f
The service was active, sleeping between ten-second checks, with the expected threshold and 30-minute cooldown. That verifies the monitor is running. It does not prove that it has recovered a real recurrence.
The recovery script can also make things worse
A failed gateway ping does not uniquely identify a failed NIC. The switch may be rebooting, the gateway may be down, ICMP may be filtered, or the host may have a routing problem. In each of those cases, bouncing the interface adds disruption without repairing the cause.
There is also a Proxmox-specific hazard: cycling the physical trunk interrupts every bridge and VLAN above it. The Proxmox network guide warns that careless interface-down operations can interrupt guest traffic and may not restore it as expected. I would not deploy this script on an HA node, a remotely hosted machine, or a host without console access until I had tested the exact bridge topology during a maintenance window.
Before enabling automatic recovery, I check:
- the gateway is stable and intentionally answers ICMP;
- the interface name cannot change after a kernel or hardware update;
- a local console or out-of-band route exists;
- no bond, bridge, or HA policy expects a different recovery action;
- the cooldown is longer than any ordinary upstream maintenance;
- the notification script contains its credentials outside the article and outside world-readable files.
To stop the automation without changing the network, I can always run:
systemctl disable --now link-guard.service
What I actually learned
The cable was never the whole fix. Replugging it merely forced the adapter and switch to negotiate again. The logs were the evidence: the host stayed alive, e1000e reported repeated hardware-unit hangs, the physical link dropped, and every VLAN above that link followed it down.
EEE and ASPM remain testable suspects, but the captured state did not convict either one. The guard is therefore not presented as a cure. It is a carefully delayed hand reaching for the same reset I had been doing manually, with enough logging to leave a trail the next time it happens.
Sometimes reliability begins before the root cause is gone. It begins when the failure stops being silent.
Buy Me a Coffee